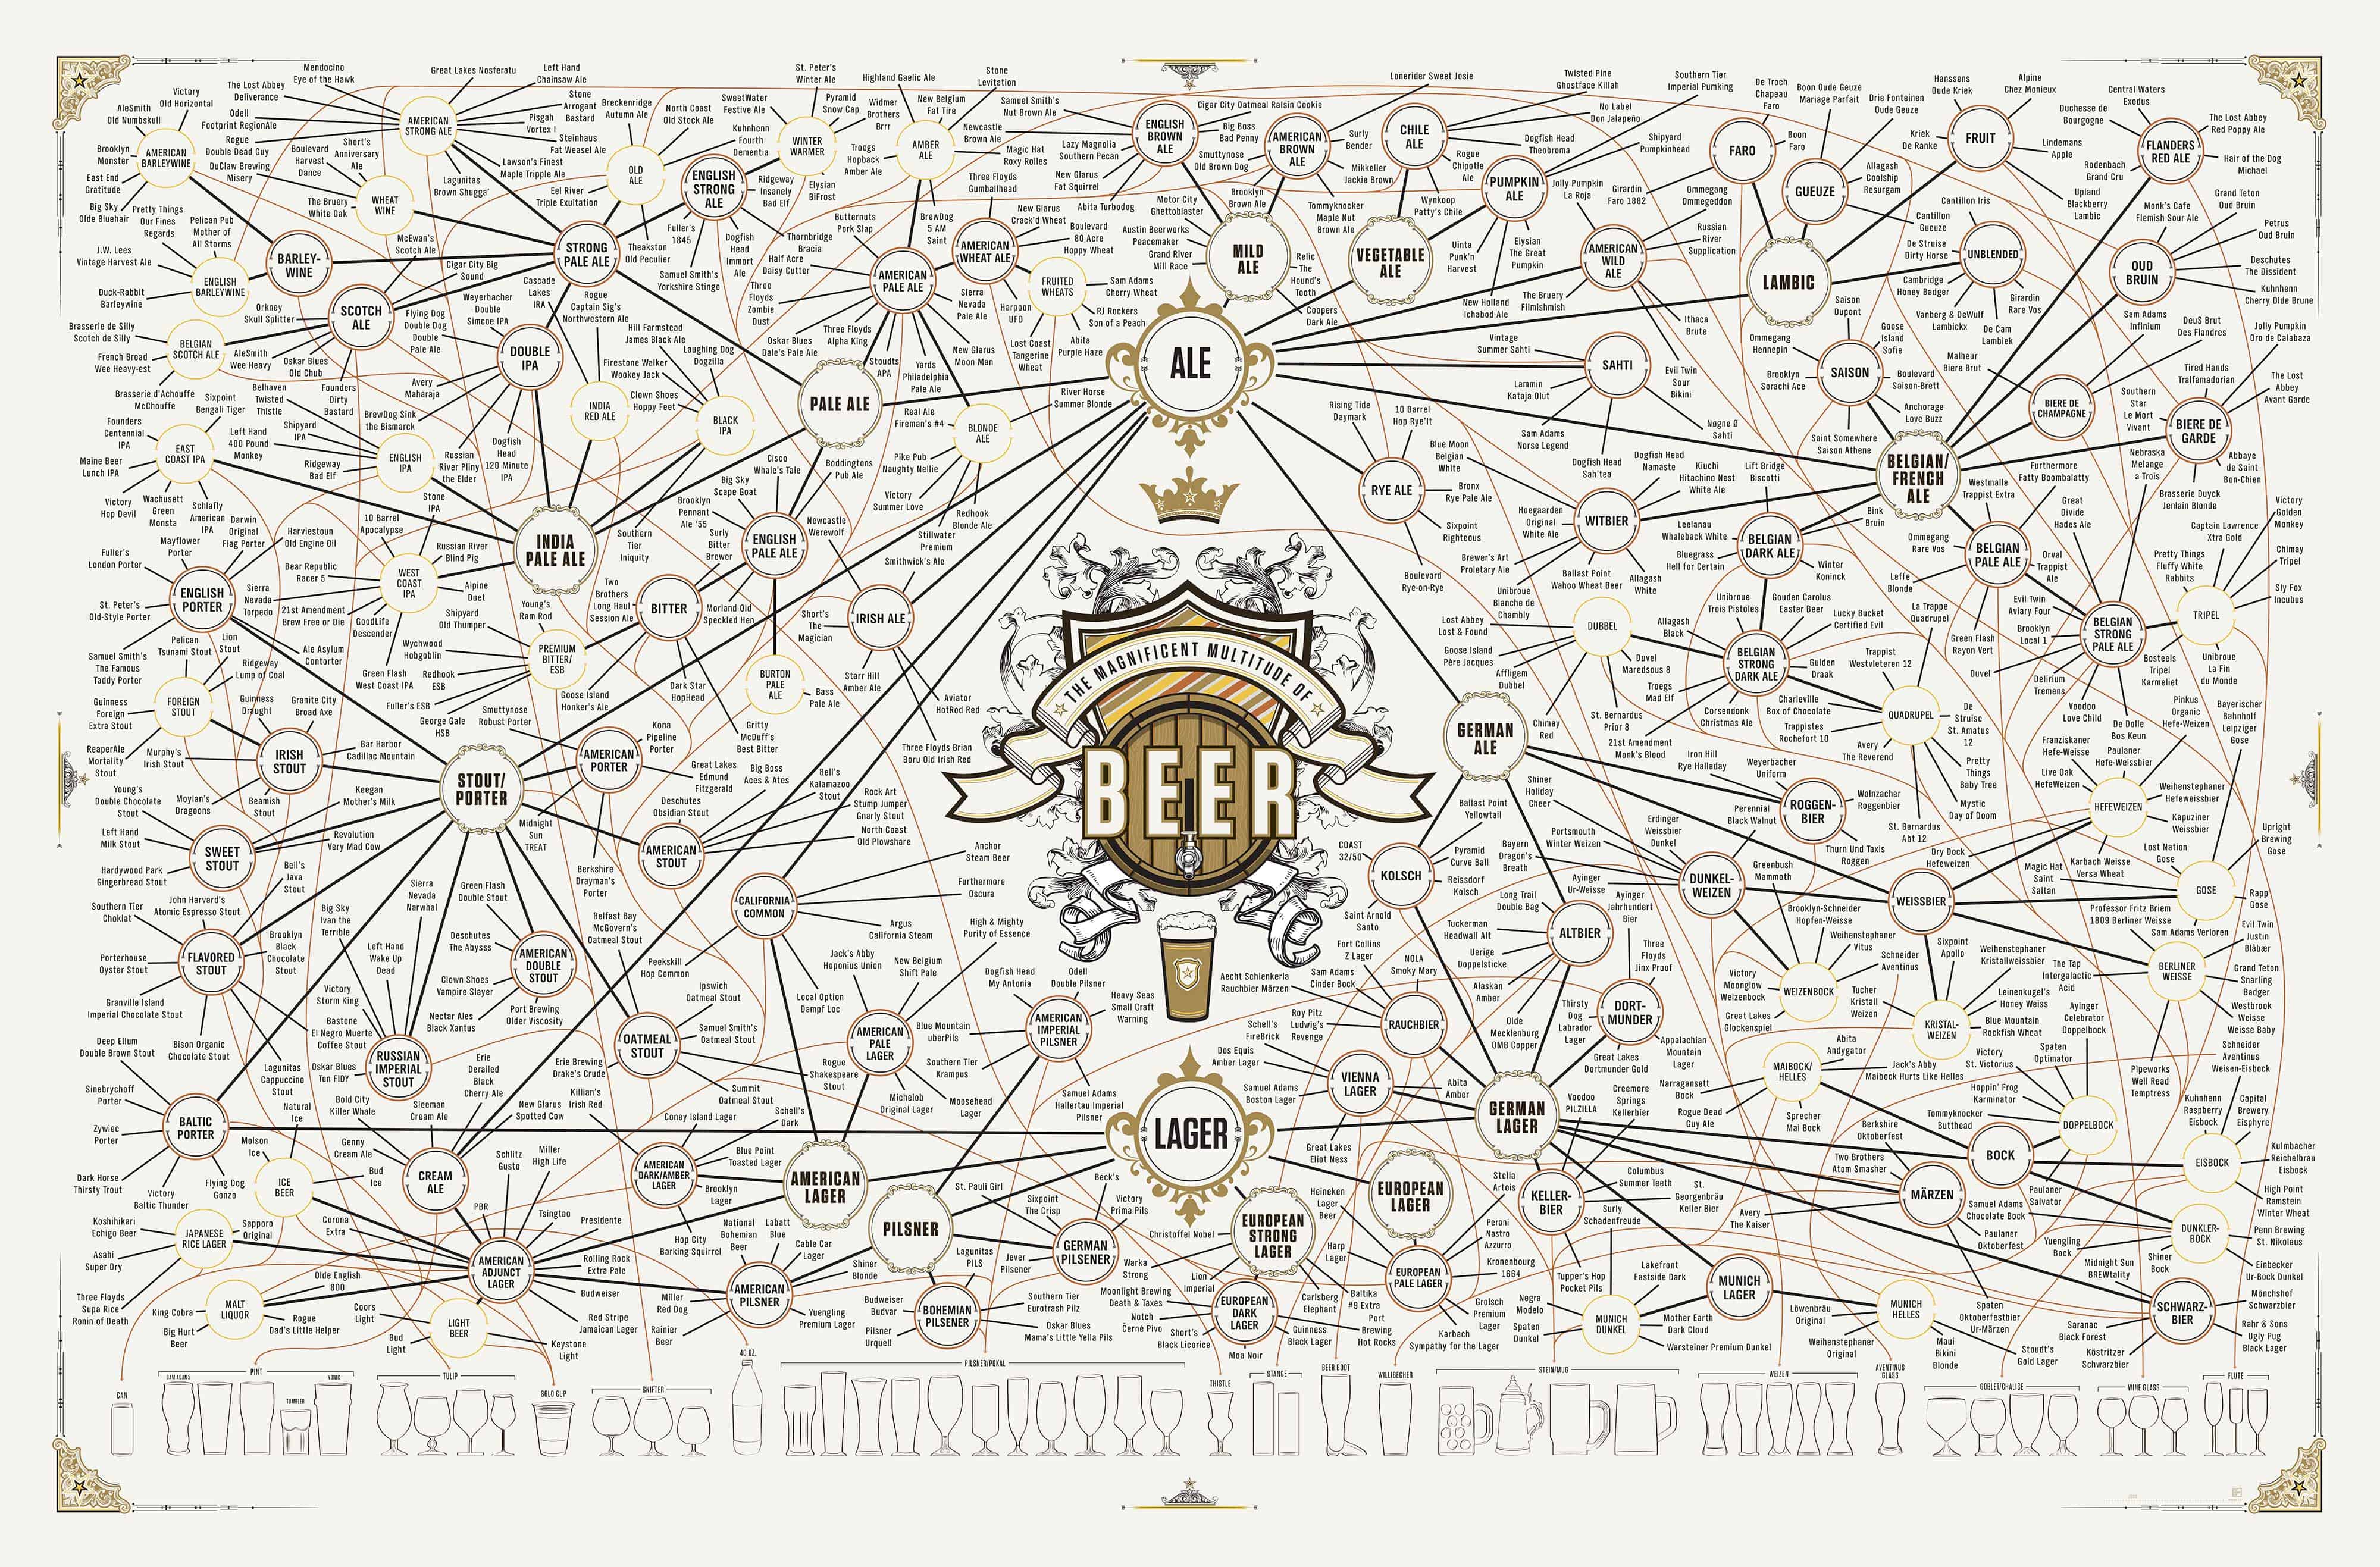
The Magnificent Multitude Of Beer [infographic]

If you’re anything like me then your first experiences with beer was probably an American lager. To be more specific you were probably trying to force down some warm Keystone next to your classmate’s pool while their parents were out of town. If you’re anything like me then you probably see your high school self as some absurd caricature of embarrassment. Maybe American brewing will never be taken seriously. At least it’s appropriate in the sense that it’s hard to take yourself seriously when you can’t recall any memory where a case of light beer was present.

Some people find that an ice cold Natty still gets the job done while others have become full fledged beer snobs. Either way there’s something to learn for even the most knowledgable beer drinker from this infographic. Be sure to take this information and use it wisely however. Nobody likes the guy who won’t shut up about his imperial stout, but nobody likes that dude who’s running around the party wearing the empty cardboard that once housed twentyfour blue and silver cans on his head either. There’s a time to kick back and indulge in a microbrew and there’s time when you need utility in a can because you’ve just got to rage. All things in moderation.

[Via]

Click the image for a larger version.

Qs8hHvh


© Dylan Cope for Daily Infographic, 2014. |
Permalink |
No comment |

Post tags: alcohol, ale, american lager, beer, brew, drink, imperial stout, india pale ale, IPA, keystone, Lager, microbrew, natty, Pilsner, porter, Stout

Smoking Timeline [Infographic]

To quit smoking cigarettes may seem like a simple goal for some people, but as many smokers know (myself included), it’s easy enough to talk about quitting cigarettes, but actually doing so can be much more difficult. I’ve tried unsuccessfully to quit more than once, and while I know that quitting for good might be rough, it will be worth it. It may take a few hard weeks to fully kick the habit, but once it’s done the health benefits are completely worth the struggle (and that’s what’s most important, right?).

Today’s infographic gives us a look at both the short term and long term benefits of putting down cigarettes permanently. Benefits start kicking in as early as 20 minutes, with blood pressure, body temperature and pulse rates going back to normal. A few more months down the line and you’re starting to breathe easier and don’t get winded as often during physical activity. That’s just the beginning, too: risk of deadly disease drops significantly after a few short years of non-smoking, and that’s something worth considering.

For more info on some of many good reasons to quit smoking, have a look at the infographic below. [Via]


© Grayson for Daily Infographic, 2013. |
Permalink |
No comment |

Post tags: cigarette smoke, cigarette smoke infographic, cigarettes, cigarettes infographic, health benefits of stopping smoking, health benefits of stopping smoking infographic, health benefits smoking cessation, health benefits smoking cessation infographic, quitting smoking, quitting smoking infographic, smoke, smoke infographic, smoking, smoking cessation, smoking cessation infographic, smoking infographic, smoking side effects, smoking side effects infographic, stop smoking, stop smoking cigarettes, stop smoking cigarettes infographic, stop smoking infographic

Infographic: How to Create the Perfect Password

So what constitutes the “perfect” password? If you’re serious about security, a strong password will include a mix of upper and lower case letters, numbers, symbols, and even non-keyboard characters. It will be unique (using the same password for everything might be common, but it’s also spectacularly unsafe). Strong, adequate, or weak, no password can protect against every possible threat. But by following our tips, you can help keep your social media accounts in your own hands, make your financial info safer, and encourage meddling thieves and hackers to seek easier prey.
[simpleazon-image align=”none” asin=”B002XLERF8″ locale=”us” height=”101″ src=”http://ecx.images-amazon.com/images/I/41ri0KHOkQL._SL160_.jpg” width=”160″]

How-to-Create-the-Perfect-Password-1

50 Things Every Traveller Should Know [infographic]

Have you been lusting over Pinterest pictures of Barcelona recently? Or dreaming of a chance meeting with the elves in Iceland? Maybe the undertaking of planning your backpacking trip across Europe has left you exhilarated, but at the same time, feeling a bit like a caricature of ‘the ignorant American’.

Have no fear! Today’s infographic shows us fifty things that will make us all more culturally aware of the countries we visit and better travelers in general. For starters, it’s not a bad idea to know the names of at least eight cathedrals or churches in Europe; also, know that Russians like their vodka straight — no mixers, please.

Be sure to know the difference in personal space in South and North America — South Americans like to get close when engaging in conversation, while North Americans may view this behavior as an invasion of personal space; wear clothes with lots of pockets when boarding a flight (if pockets are utilized correctly you could find yourself with an extra carry-on!); and go ahead and memorize your passport number — this can come in handy when you’re checking into your hotel, or renting a car, or when you’re filling out your customs form on the flight home and the exact location of your passport in your oversized/overstuffed bag escapes you.

Before you score a plane ticket, check out today’s infographic, and bask in your new-found knowledge of the world. [Via]

fifty-thing-traveller-should-know-full


© Micaela Lacy for Daily Infographic, 2014. |
Permalink |
2 comments |

Post tags: africa, airports, Asia, countries, culture, customs, europe, flight, flights, International, international airports, plane, planes, travel, traveling, traveling tips, traveller, travels

When Ugly Turns to Beautiful: Ugly Christmas Sweater [infographic]

Until reading this infographic put together by UglyChristmasSweater.com, I was not aware of just how popular the ugly Christmas sweater is. I, like Canada, wanted to believe that my friends and I had thrown the first ugly Christmas sweater party in history. In other words, I was certain that I was the first ever to wrap myself in itchy wool and ironic jingle bells while drinking warm cider in the dead of winter with my friends.

This year I think I will be the first to wear them genuinely. No ulterior motive, just a celebration of all things merry and bright written all over my sweater. When people ask me why I wear them all the time, I will respond by saying, “Because I love Christmas.” Then I will wink in the direction of the North Pole. Or is that already a thing too?

I will also be buying each and every one of my siblings one. What better way to ring in the holiday cheer than with all four siblings wearing red “Merry Christmas You Filthy Animal” sweaters while Home Alone (as per Christmas usual) plays in the background? The answer is, nothing. There is nothing that would make my siblings and I happier than that! So do what you must, but know, that no good Christmas without ugly Christmas sweaters goes unpunished. Let UglyChistmasSweater.com take care of you. [via]


© Lindsey Lawrence for Daily Infographic, 2013. |
Permalink |
No comment |

Post tags: christmas, gifts, holiday, Holiday Gifts, holiday shopping, Home Alone, shopping, sweater, ugly christmas sweater

Which Major City is Best to Live In? [infographic]

Well, I finally got a big girl job and am making a big move from the Rio Grande Valley (southern Texas), all the way to north Austin. I’ve always loved Austin, but I’m not too familiar with it. So naturally, I’ve been researching EVERYTHING about Austin. Places to eat, fun things to do, different parks, etc. During my search, I came upon this interesting infographic, “Which Major City is Best to Live In?” Luckily, Austin made that cut. According to today’s infographic, Austin is the 12th best place to live, and is considered the city of live music. Other great cities made the cut too, such as: San Diego, Scottsdale, and Raleigh.  Ready for a change and looking to move? Check out today’s infographic to see what these fabulous cities have to offer! [via]


© Jasmin for Daily Infographic, 2013. |
Permalink |
No comment |

Post tags: austin, best, Cities, diversity, Fun, life, Moving, music, Nightlife, population, Raleigh, San Diego, Scottsdale

Would You Live in a Haunted House? [Infographic]

Many holidays that we celebrate have one or two traditions that truly define them, but they also have many other smaller traditions. Halloween is no exception to the rule: while dressing in costumes and trick-or-treating are the most defining Halloween traditions, we also have things like pumpkin carving, hay rides and haunted houses that are associated with the holiday. Haunted houses can be a lot of fun to visit around Halloween, with all of the decorations and people putting on a scary show, but the question is: would you actually live in one?

Today’s infographic from the Huffington Post and Realtor.com shows us just how many Americans would choose to buy or live in a haunted home, given the choice to do so. Out of those surveyed, 62% would consider buying a “haunted” house while 35% said that they have already lived in one. When asked what would make a house haunted, most agreed that a cemetery on the property would do the trick, although the answers ranged all the way to having an old battlefield near the home.

For more info on buying haunted homes, have a look at the graphic below. [Via]


© Grayson for Daily Infographic, 2013. |
Permalink |
No comment |

Post tags: battlefield, battlefield infographic, cemetery, cemetery infographic, ghost, ghost infographic, ghosts, ghosts infographic, graveyard, graveyard infographic, haunt, haunt infographic, haunted, haunted home, haunted home infographic, haunted house, haunted house for sale, haunted house for sale infographic, haunted house infographic, haunted houses, haunted houses infographic, haunted infographic, house is haunted, house is haunted infographic, spirit, spirit infographic, spirits, spirits infographic, what makes a haunted house, what makes a haunted house infographic

1 34 35 36 37 38 40