10 Ways Technology Can Raise Your Creative Game

What most people fail to realize at first glance is the role of technology in the exponential growth of creative ideas. Technology has made it a lot easier to bring creative minds and ideas closer and take those ideas further at the same time. This mixing of technology and creativity has brought innovative new ideas and avenues through which people can express themselves. Discover 10 really easy ways to up your creative game with this infographic by Acuity Training.


Infographic showing the 10 ways technology can improve your creativity
Courtesy of: Acuity Training

Kids These Days [Infographic]

Get off my lawn with your iPads, ya hooligans! If you know kids these days, you’ll know that they just love technology, let me tell you what! In fact, there are so many different tools to utilize, it’s hard to even know what kinds to invest in. Cell phone, iphone, ipad, nexus, android, mac, pc, etc. It’s a bit boggling.

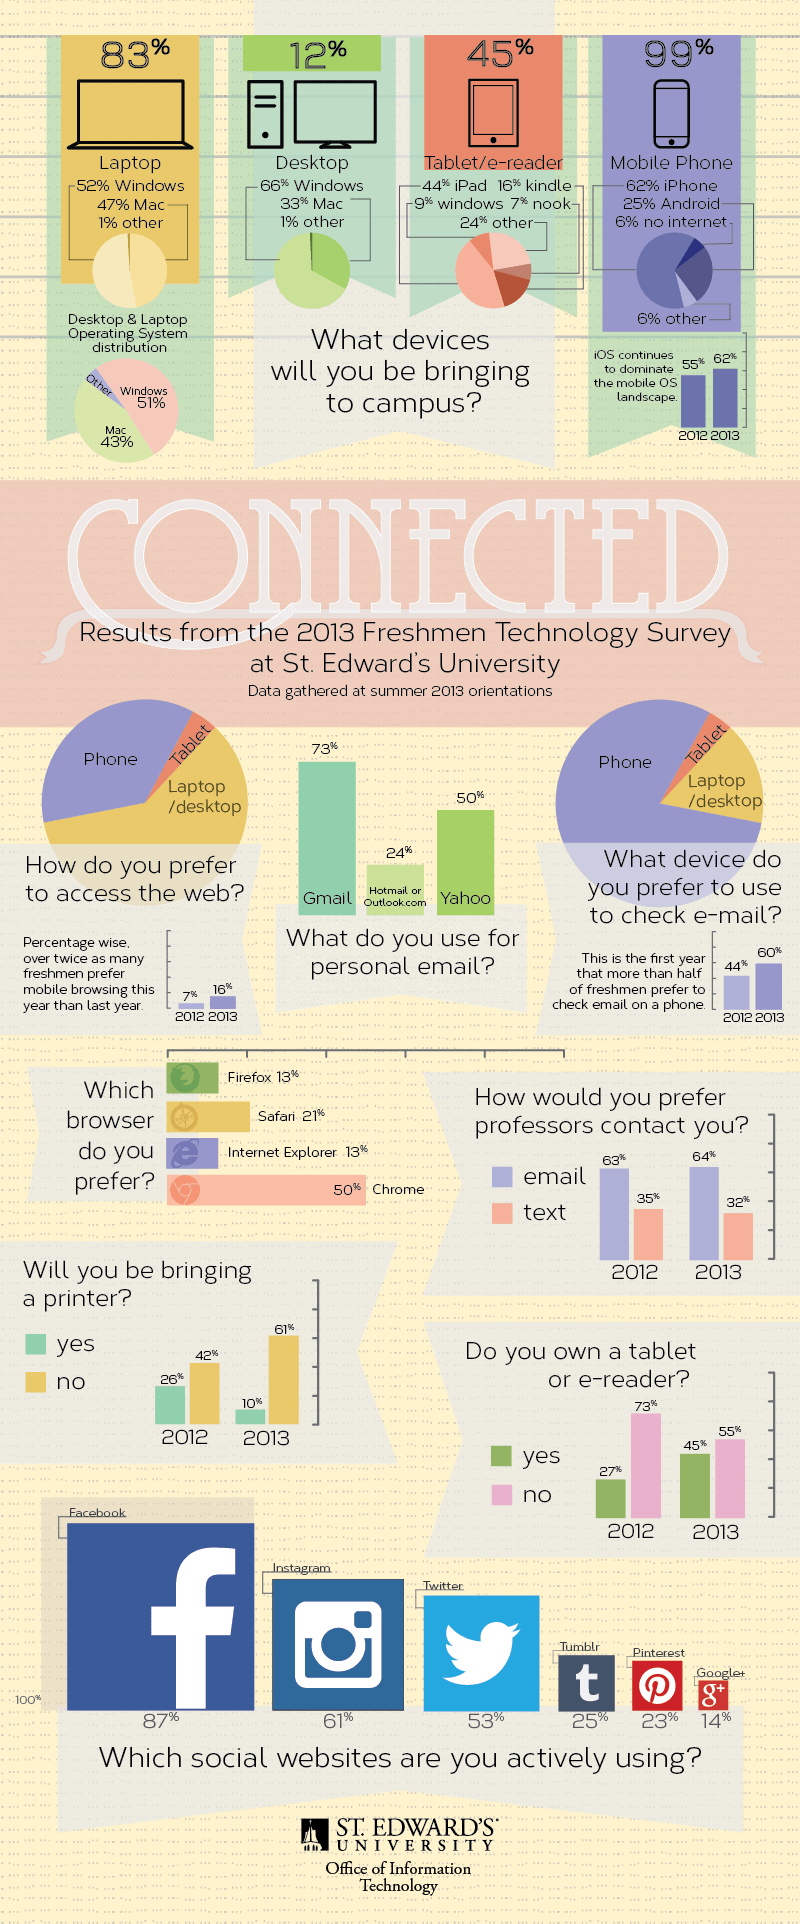
This infographic, done by a local college, investigates what percentages of Freshman students are bringing in what. Granted, this is a smaller, private college, so the results may be skewed from your own, but nevertheless illuminates what technologies are being utilized the most in preparation for BECOMING AN ADULT BY GOING TO COLLEGE (echo). In all seriousness though, technologies really are shaping the modern job market and what is possible in global communication, as well as education.

The top-most percentages correspond with the overall campus population. The smallest number of these happens to be desktop computers. This isn’t surprising due to the popular use of laptops for portability and for taking notes in class; but more and more I’ve found that tablets are becoming very popular for this particular task. It’d be awesome to know what percentage would prefer taking notes on tablets as opposed to laptops…

All in all it’s a great age to live in where media, art, and knowledge can be so easily communicated across our planet. The future of education really does lie in the digital realm.

[via]


© Eric Lyday for Daily Infographic, 2013. |
Permalink |
No comment |

Post tags: android, browser, cell phone, chrome, college, Computer, desktop, e-reader, email, facebook, firefox, Freshman, gmail, google, hotmail, Instagram, internet explorer, iPad, iphone, macbook, microsoft, mobile, OS, own, pintrest, printer, safari, St. Edwards University, students, tablet, technology, text, tumblr, twitter, Windows, yahoo

Are You a Cat Person or a Dog Person? [infographic]

Forget baby fever. I have a serious case of animal fever. The same thing happened to me about a year ago when I got my bunny Bella. Don’t get me wrong, I love my rabbit. She is absolutely the most adorable thing I have ever owned. I just want another friend, and for her to have a friend. While the obvious choice is to get another rabbit, they won’t always bond together. I know for a fact that Bella likes dogs, but I can’t decide what I prefer.

Have you ever wondered if you’re more of a dog person or a cat person? Did you know your personality, education, certain preferences and even where you live influence which you care more for? For instance, cat people are more likely to be introverts while dog people are more likely to be extroverted. Women are more likely to own cats, and students are more likely to own dogs. A lot of these statistics seem fitting, especially based on the personality types of most dogs and cats I’ve come across. I think the most interesting category of differences is how people use or view technology.

After discovering this infographic, I feel no closer to making a decision on what animal I should get next. Unfortunately, I identify equally with a lot of the characteristics for both types, particularly those concerning personality. Since I can’t decide between a cat and a dog, I guess I’ll just have to get both.

[via]


© Aisling Clare for Daily Infographic, 2014. |
Permalink |
No comment |

Post tags: animals, Cat, cat people, Dog, dog people, education, favorites, identity, location, personality, pet owners, Pets, technology

How Many Lines of Code Does it Take? [Infographic]

They say that coding is a language of sorts. A series of text files that ultimately are turned into 1′s and 0′s that make up a localized universe of whatever the coder intends. In this way I like to think about the programs and operating systems that we use everyday as books of sorts, and coders as the authors of these books. I know the book analogy is kind of pushing a bit far from the source, but for me it’s a way to mentally picture how much typing, thought, and information goes into the operating systems of the technology of today.

I’m not a coder myself (so please correct me if I butcher this) but basically a line of code constitutes some sort of variable to be analyzed by a computer calculator. There can also be lines of logistical preferences – action words that give input as to what to do with these variables. Also there can be lines in which to comment on these previous iterations of code – this serves to help the coder remember what the heck all of these lines of code mean. Although I’m not sure if the statistics of this infographic pertain to comment code (most likely not), it is quite astounding just how many lines of code it takes to make some of these technological operations work. Facebook for instance has at least 15 times more code in it than a Large Haydron Collider does (pre debugging). I don’t know about you, but that is kind of frightening and amazing at the same time.

[via]


© Eric Lyday for Daily Infographic, 2013. |
Permalink |
22 comments |

Post tags: code, computers, facebook, large haydron collider, lines, operating systems, technology