The Psychology of Book Abandonment [infographic]

How much time do you invest in a book you can’t get into before you decide it’s time to cut your losses? What is your breaking point? Goodreads put together an infographic highlighting the top-five books abandoned by Goodreads’ users. Unsurprisingly, three of the five I have abandoned myself. But reading this infographic got me thinking a lot about the psychology behind an abandoned book.

I rarely abandon books; I feel defeated when it happens. In fact, before today I would have claimed that I always finish books–even if I hate them. I abandoned Eat Pray Love with one chapter to go, Fifty Shades of Grey 250 pages in, and The Girl With the Dragon Tattoo after the first chapter. I haven’t read Casual Vacancy for fear of having an abandoned J.K. Rowling book on my record. All of these books were recommended to me. I am afraid that I tend to neglect books that are recommended and then lent to me to read. I generally read books according to where I am in life emotionally. If I am reading a book that I haven’t already created some prearranged attachment to based on the level of emotional support I need it to provide me at the time, I just can’t get into it.

What’s your stance on abandonment? Are you an always-finish-no-matter-what kind of person? Have you ever hated the main character of a book? Do you hide your book covers in the airport because your reading selection embarrasses you? And most importantly, has anyone (other than my sister whom I envy for her reading abilities) read Catch 22 cover to cover? [via]


© Lindsey Lawrence for Daily Infographic, 2013. |
Permalink |
No comment |

Post tags: Abandoning Books, books, Goodreads, Psychology of Book Abandonment, Psychology of Reading, reading, Top Five, Top Five Abandoned Classics, Top Five Most Abandoned Books


The Evolution of the Geek [infographic]

First off, there are not enough infographics out there about Dungeons and Dragons, will someone send me one if they find a good one please? Second, screw this infographic. It started off really well with where the term “geek” came from, good deal! Then continues over to Geekus prime and onto computer geek; nothing is said about the computer geek, which is a very important geek, because he is what the internet geek is based upon!

Also, I am very annoyed by the book geek as I’m sure others are. Harry Potter, Narnia and Twilight are so general, all walks of life read those books, and the Lord of the Rings are perhaps more “geeky” but still very popular. What about Sci-fi books? Or old mediaeval times books? — So much more of a geek fest genre.

The artist got a little lazy on the “geek Chic” because these are not variants of geek chic, a theatre geek doesn’t dress that way to be ironic — a theatre hipster might. A food geek doesn’t dress that way either. These are more just hobbies people have. These are all things really upsetting me. I wouldn’t have had to complain about all this if someone had just made a decent D&D infographic.

By the way, I am playing my first game of Dungeons and Dragons today, and I cannot wait. Any advice will be appreciated.
[via]


© Lena Long for Daily Infographic, 2013. |
Permalink |
One comment |

Post tags: Chic, Computer, Dungeons and Dragons, Geek, Geken, Harry Potter, hipster, narnia, tech, theater, WOW

Are You a Cat Person or a Dog Person? [infographic]

Forget baby fever. I have a serious case of animal fever. The same thing happened to me about a year ago when I got my bunny Bella. Don’t get me wrong, I love my rabbit. She is absolutely the most adorable thing I have ever owned. I just want another friend, and for her to have a friend. While the obvious choice is to get another rabbit, they won’t always bond together. I know for a fact that Bella likes dogs, but I can’t decide what I prefer.

Have you ever wondered if you’re more of a dog person or a cat person? Did you know your personality, education, certain preferences and even where you live influence which you care more for? For instance, cat people are more likely to be introverts while dog people are more likely to be extroverted. Women are more likely to own cats, and students are more likely to own dogs. A lot of these statistics seem fitting, especially based on the personality types of most dogs and cats I’ve come across. I think the most interesting category of differences is how people use or view technology.

After discovering this infographic, I feel no closer to making a decision on what animal I should get next. Unfortunately, I identify equally with a lot of the characteristics for both types, particularly those concerning personality. Since I can’t decide between a cat and a dog, I guess I’ll just have to get both.

[via]


© Aisling Clare for Daily Infographic, 2014. |
Permalink |
No comment |

Post tags: animals, Cat, cat people, Dog, dog people, education, favorites, identity, location, personality, pet owners, Pets, technology

Marathons by the Numbers [infographic]

As you know, the Boston Marathon was this past Monday. Normally the Boston Marathon is a special event for all runners because it is one of the most prestigious running events around. Many runners hold the Boston marathon as a life goal to reach because of the incredibly tough qualifying times. For example, As a 23 year old female I would need to run 26.2 miles in 3 hours and 35 minutes. Thats about 8:12 minutes per mile, for 26.2 miles! I could only hope to keep that pace if I was running downhill with the wind at my back. Boston Marathon aside, marathon races are a true feat of strength that requires rigorous training, a healthy diet, and extreme dedication. Don’t let the qualifying times discourage you, a friend of mine went from being an overweight couch potato, to a 2014 Boston Marathon finisher averaging a 7 minute pace throughout the race. Are you inspired yet? Check out today’s infographic about marathons and see how many marathons your state hosts. Maybe set a goal to complete a marathon this time next year! I’m certainly inspired. I know I already have my sights set on next year’s Austin Marathon! Ready, set, run! [via]


© Jasmin for Daily Infographic, 2014. |
Permalink |
2 comments |

Post tags: 26.2, average, Boston, marathon, men, People, qualifying, run, states, training, water, Women

Cost Of Owning A Pet [Infographic]

22 years old, and college graduation approaches. I can’t think of a more perfect graduation present to myself than a dog. I have a job lined up, a house with a yard- why not?

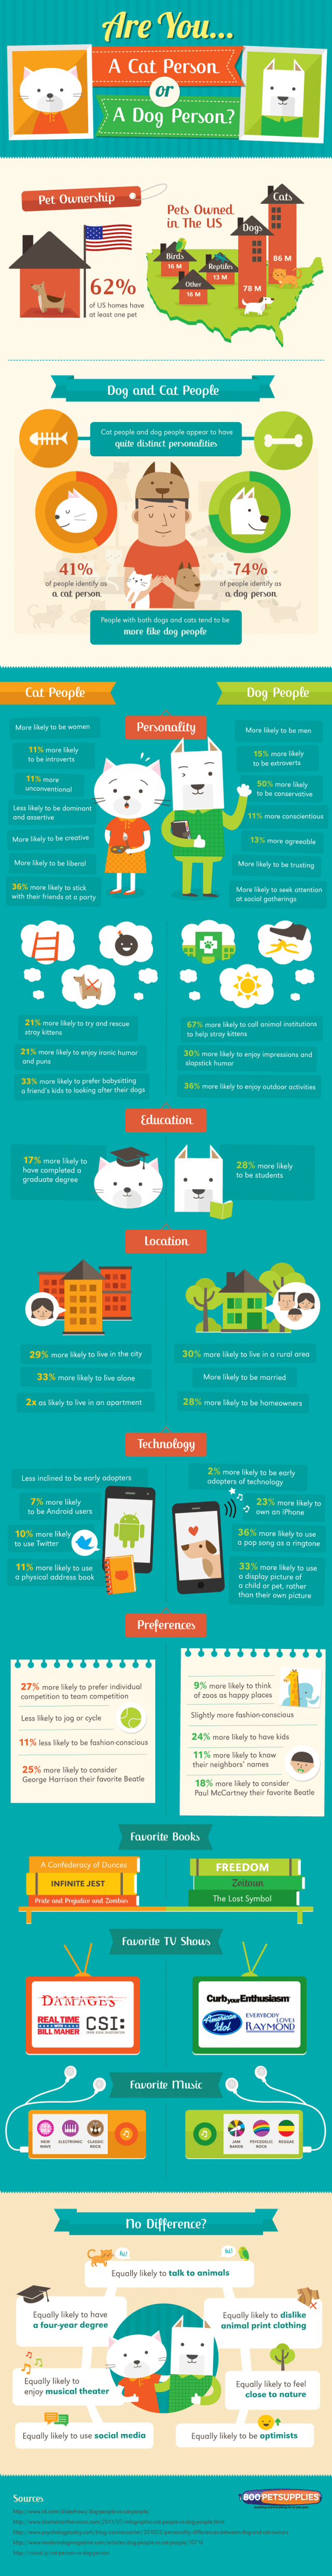
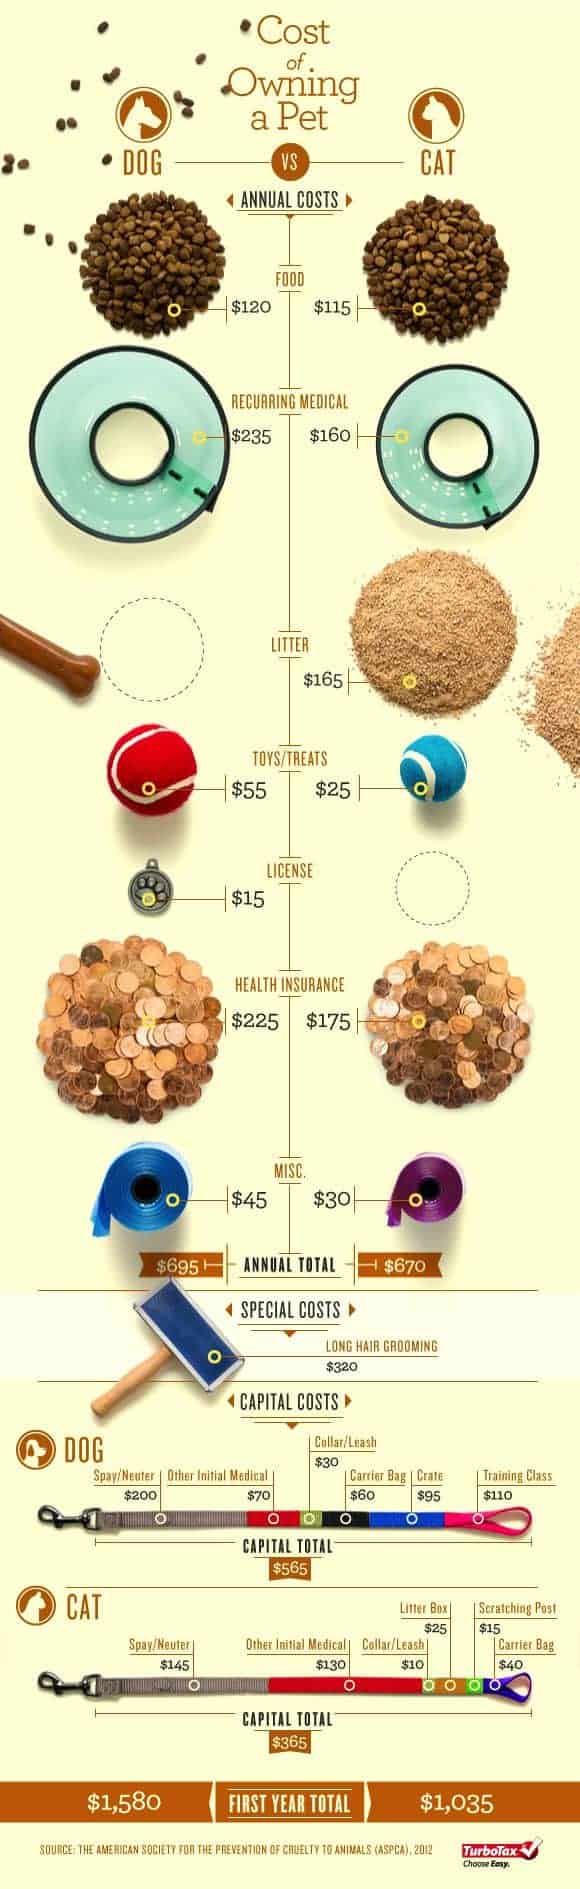
Well this infographic might make me think twice. It outlines the first year cost of dogs and cats (I’m not a cat person, so personally I’ll be disregarding that but it’s useful info for you cat people).

My first instinct told me that food would probably be the biggest cost. Not quite. Health insurance and reoccurring health related expenses together cost nearly four times the $120 it takes on average to feed a dog for a year. The numbers for cats are significantly lower than that- but it still costs quite a bit more to keep a cat healthy for a year than it does to feed it.

Remember Bob Barker, “Get your pets spayed or neutered!”- that’s good and all, but he never mentioned how much that costs: $200 for a dog and $145 for a cat. I guess that’s s small price to pay to avoid running a puppy mill and or kitten haven, but that’s definitely not chunk change.

Looks like getting a dog might cost a little bit more than I thought- this infographic estimates that it would cost about $1,500 in the first year. Yikes. Good thing I got that job. It’s less than that for a cat- $1,035, but cats are nowhere near as cool as dogs (sorry!). When was the last time you saw a cat fetch? Anyway- if any of you out there are thinking of acquiring a pet, take a look at this infographic first and make sure you can afford it, otherwise you’ll be eating ramen every night to make sure you can feed that furry friend. [Via]


CostofPets


© Erich Scholl for Daily Infographic, 2014. |
Permalink |
No comment |

Post tags: adulthood, animals, Cat, Dog, Expenses, finance, lifestyle, money, pet costs, Pets

How To Extend Your Life At Work [Infographic]

I hate talking about work just as much as the next person, I would much rather talk about the football game- or just drink a beer and talk about nothing. However, considering the average American spends 90,000 hours at work over the course of their lifetime deserves a conversation.

There have been many infographics posted about how work (or working too much) can contribute to an early death. With this information, the answer seems simple- don’t go to work! Well, if you have bills, rent, and car payments hanging over your head this is simply not possible. So all the average person can do is figure out why bad habits to avoid at work that are the #1 contributors to an early death.

According to this infographic, the more an individual sits down during their waking hours the shorter their life expectancy is. While the actual numbers may be a little more fuzzy- sitting down (no matter how good it feels) is not terribly healthy. Try and find excuses to stand up and mover around at work. This can be hard sometimes- but it can mean moving a trashcan further from a desk, or simply standing at your desk.

Work is a touchy issue for most. With all the recent findings on how unhealthy the average work environment is- combined with the fact that unless you’re born into a large trust fund you have to work 40+ hours to survive, it can often feel like a no-win situation. However, this infographic has some helpful tips to make it not quite so dire- enjoy. [Via]

HowtoExtendYourLifeatWork (1)


© Erich Scholl for Daily Infographic, 2014. |
Permalink |
No comment |

Post tags: business, death, Employment, habits, health, Healthy, life, time management, work, workplace

1 2 3