Fonts easy to read with “il1” rule

When writing a web page or blog article content quality is a key aspect. The way we present them, choosing correct fonts and layouts, is equally important.

Try to find fonts that pass the “Il1” rule. Type a capital I a lowercase l and a number 1 next to each other. If you can’t tell the difference between these characters, you may run into some trouble when setting the text.

Infographic presented by: gutflg.com

Learn Gimp:Easy Gimp Tutorials: Web Banners, E book Covers, Info Art, Image Manipulation, Text Effects, Layers

Learn how to GIMP which stand for GNU Image Manipulation Program this is a open-sourced graphic design software.This book includes easy video and written tutorials to help you create web banners, info art, e-book covers, text effects and more. This is a DIY graphic design book to help you learn GIMP fast. Learn the easy way without having to spend money on costly graphic designers. Graphic Designers are wonderful but we can’t always afford them when we are on a budget. If you have the desire how to learn simple graphics technique’s then you’ll be on your way to creating designs for you webpages, websites, blogs, e books, etc. Try these easy GIMP tutorials and you’ll be on your way. This books includes easy videos tutorials so you can start creating quickly. Trying to learn all this on your own will take months. With the information in this book you can start creating your own graphics today! Get today and get all your projects done.

The Truthful Art: Data, Charts, and Maps for Communication

No matter what your actual job title, you are—or soon will be—a data worker. 

Every day, at work, home, and school, we are bombarded with vast amounts of free data collected and shared by everyone and everything from our co-workers to our calorie counters. In this highly anticipated follow-up to The Functional Art—Alberto Cairo’s foundational guide to understanding information graphics and visualization—the respected data visualization professor explains in clear terms how to work with data, discover the stories hidden within, and share those stories with the world in the form of charts, maps, and infographics. In The Truthful Art, Cairo transforms elementary principles of data and scientific reasoning into tools that you can use in daily life to interpret data sets and extract stories from them.   


The Truthful Art explains:


• The role infographics and data visualization play in our world

• Basic principles of data and scientific reasoning that anyone can master

• How to become a better critical thinker

• Step-by-step processes that will help you evaluate any data visualization (including your own)

• How to create and use effective charts, graphs, and data maps to explain data to any audience


The Truthful Art is also packed with inspirational and educational real-world examples of data visualizations from such leading publications as The New York TimesThe Wall Street JournalEstado de São Paulo (Brazil), Berliner Morgenpost (Germany), and many more.

The Wall Street Journal Guide to Information Graphics: The Dos and Don’ts of Presenting Data, Facts, and Figures

The definitive guide to the graphic presentation of information.

In today’s data-driven world, professionals need to know how to express themselves in the language of graphics effectively and eloquently. Yet information graphics is rarely taught in schools or is the focus of on-the-job training. Now, for the first time, Dona M. Wong, a student of the information graphics pioneer Edward Tufte, makes this material available for all of us. In this book, you will learn:

  • to choose the best chart that fits your data;
  • the most effective way to communicate with decision makers when you have five minutes of their time;
  • how to chart currency fluctuations that affect global business;
  • how to use color effectively;
  • how to make a graphic “colorful” even if only black and white are available.

The book is organized in a series of mini-workshops backed up with illustrated examples, so not only will you learn what works and what doesn’t but also you can see the dos and don’ts for yourself. This is an invaluable reference work for students and professional in all fields.

2-color; 500+ illustrations, 16 pages of color

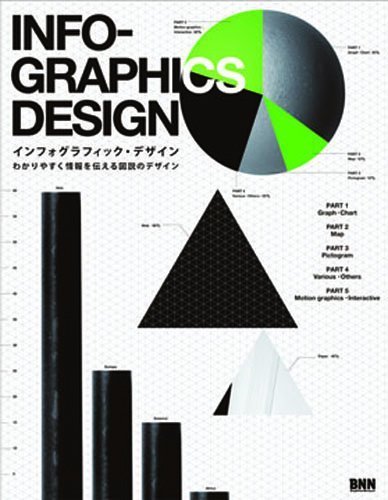
Information Made Beautiful: Infographic Design

Overwhelming amounts of information are available for readers and consumers in modern times, but how can it be made understandable, and given context and importance? The designers and creatives whose works are featured in Information Made Beautiful address these issues with projects that don t just make data easy to understand, but make it understanding it an appealing experience. Work from over 100 designers and studios includes projects for clients such as Wired Italy, the Royal Mail, Money Today, Lionsgate Entertainment, Ronald McDonald House, and the UN, as well as universities, research facilities, and private clients. These pieces range from abstract to hands-on, and break down information ranging from the status of female children in India and global water usage to coffee bean maps covering the amount of caffeine consumed in the US and crocheted diagrams of time spent crafting on German public transportation. The bright colors, eye-catching graphics, and specialty typographies of Information Made Beautiful make it easy to understand how designers are translating this new form of visual language to create information that is also inspiration.

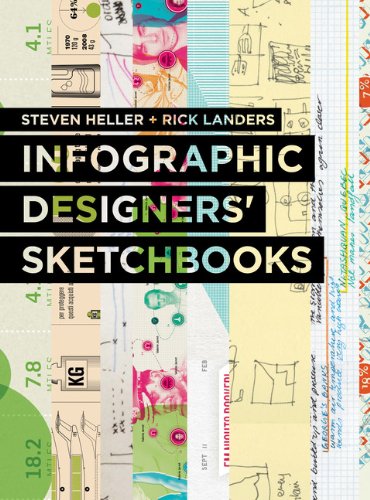
Infographics Designers’ Sketchbooks

We are living in a golden age of data visualization, in which designers are responding to the information overload of our digital era with astonishing feats of visual thinking. Using a wide variety of techniques, they transform complex ideas into clear, engaging, and memorable infographics. In recent years, books and websites have been collecting the field’s best. While stimulating, these finished projects offer little insight into how visual solutions were reached, making them of limited use to designers wanting to produce work of their own. In Infographic Designers’ Sketchbooks, more than fifty of the world’s leading graphic designers and illustrators open up their private sketchbooks to offer a rare glimpse of their creative processes. Emphasizing idea-generating methods—from doodles and drawings to three-dimensional and digital mock-ups—this revelatory collection is the first to go inside designers’ studios to reveal the art and craft behind infographic design.

1 2