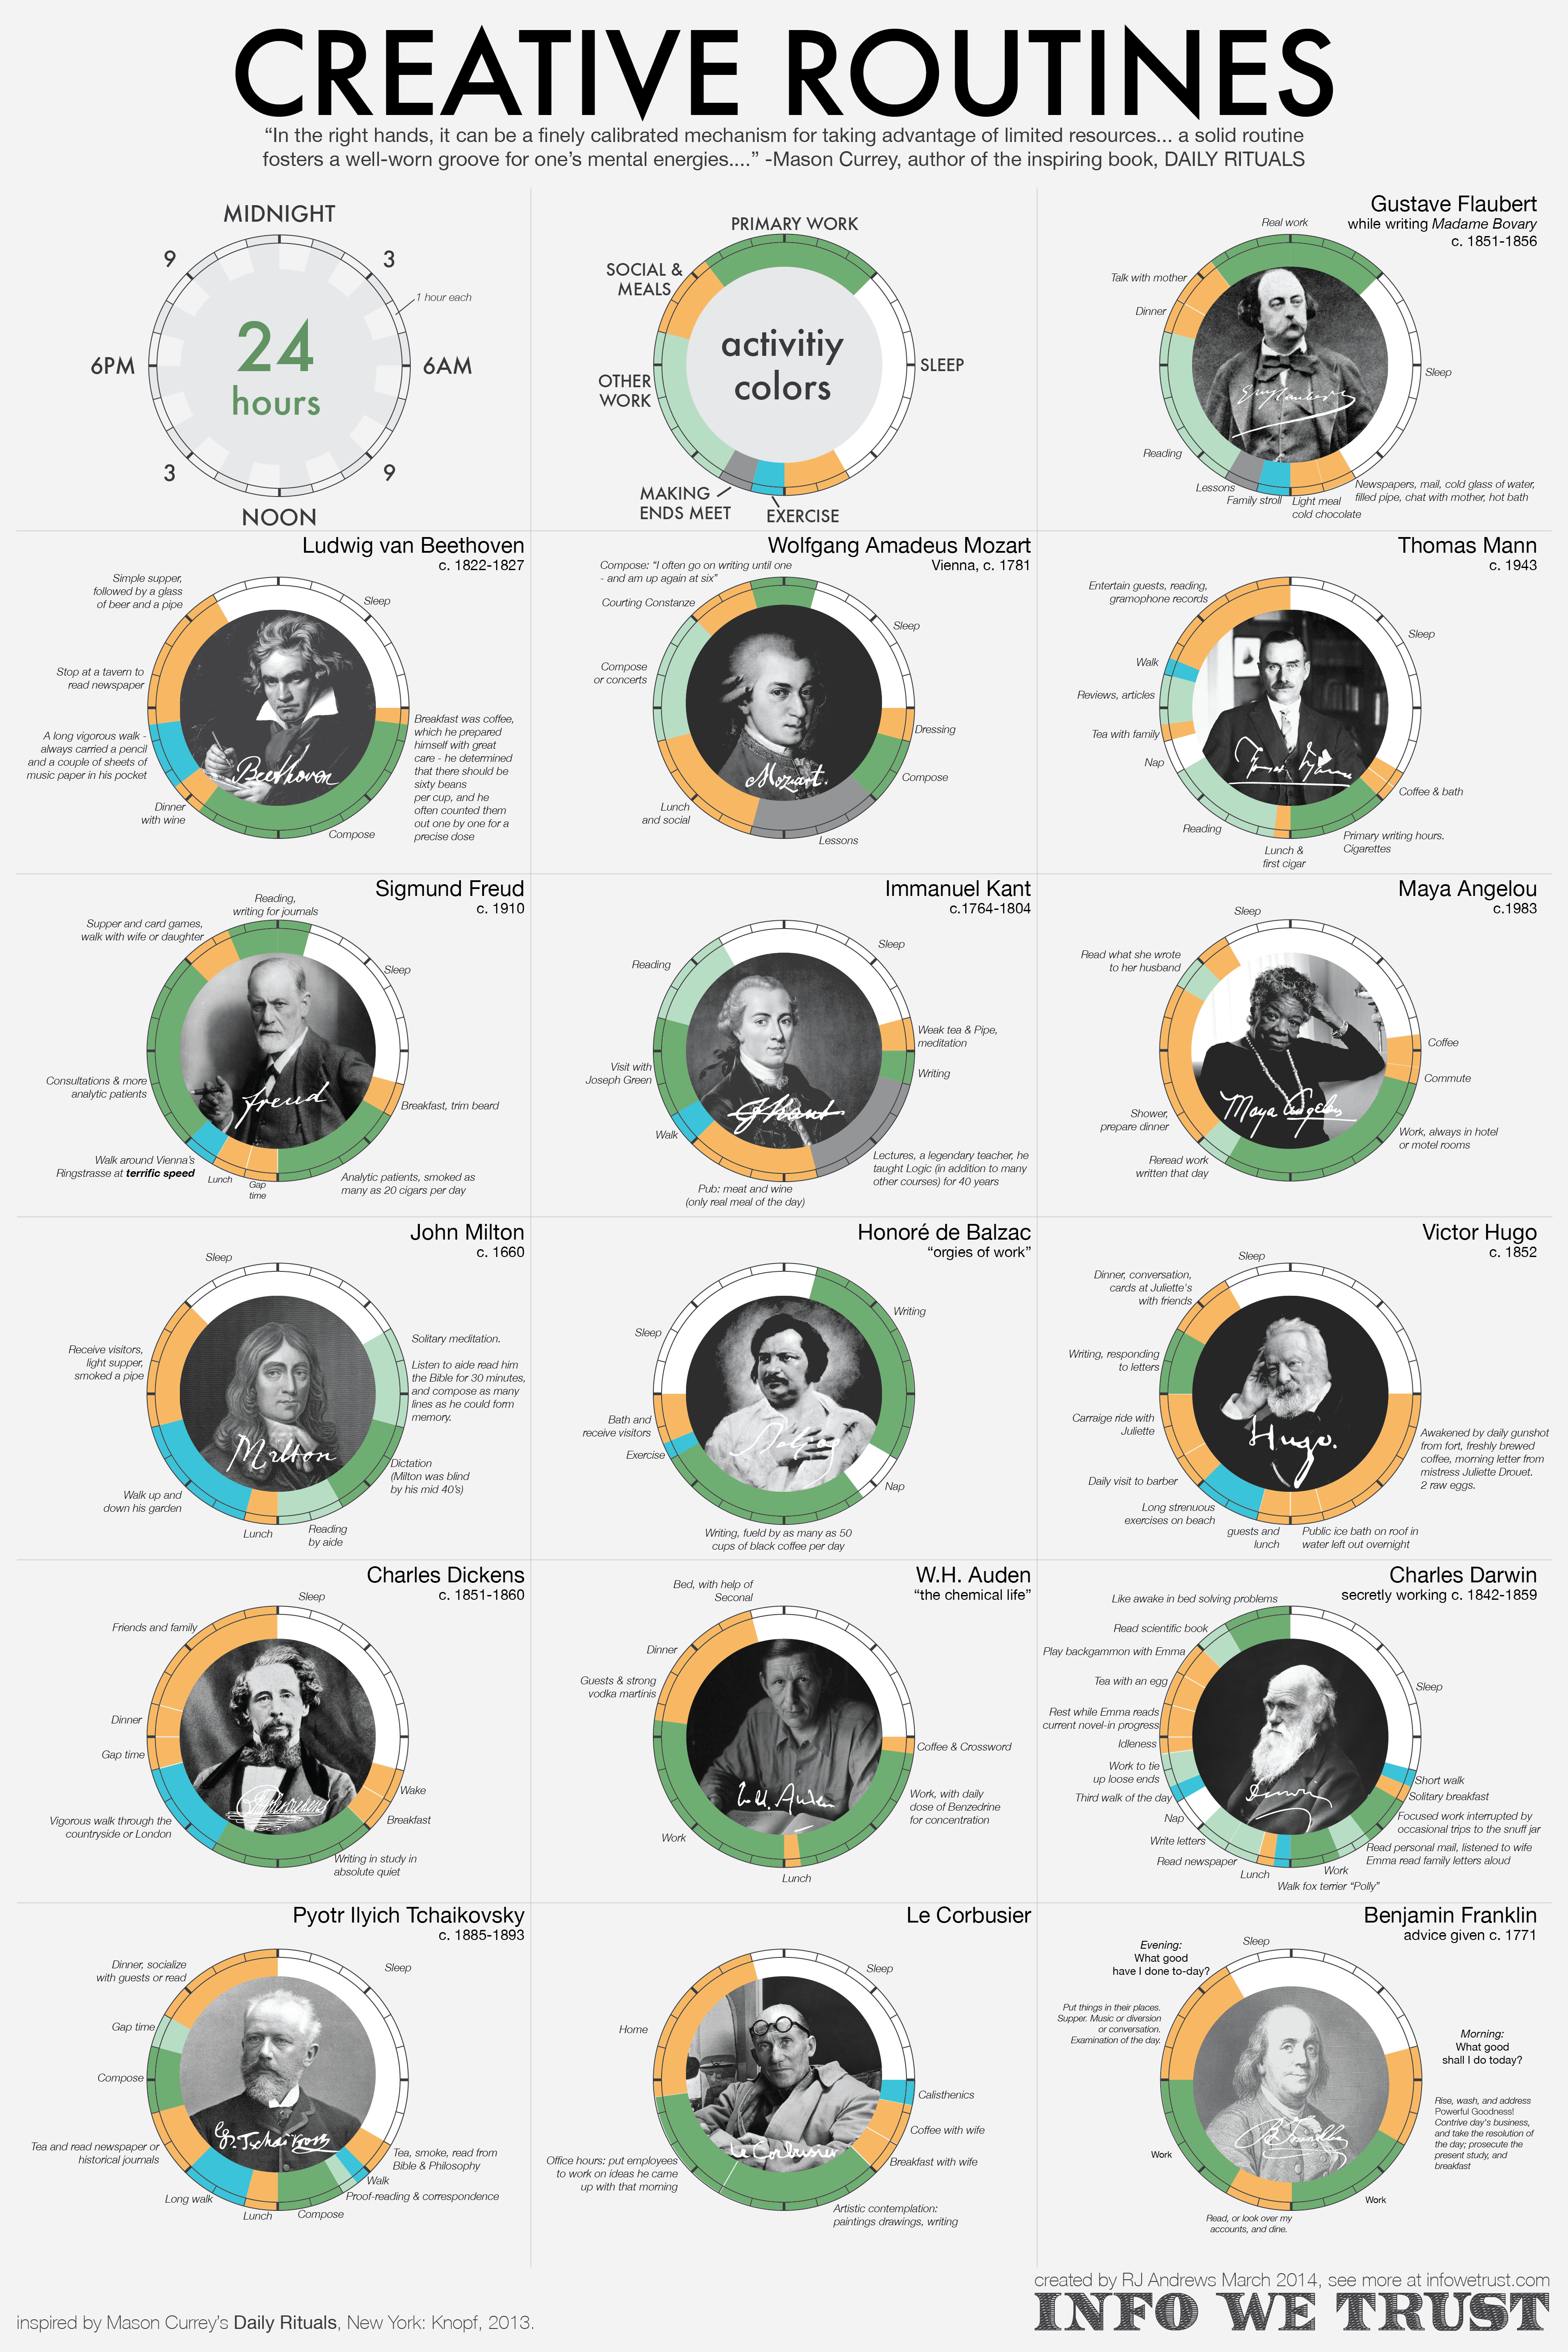
Creative Routines [infographic]

Alright, it’s time to stop whatever it is you were doing to look at what old white bearded dudes with fancy hair do with their day. At least the creator of this infographic included Maya Angelou, although it does come off as lukewarm attempt to give it some much needed balance. Regardless, the people that are mentioned certainly aren’t irrelevant chumps and there’s some pretty interesting information here.

Sure, you can draw a few parallels person to person, but there aren’t really any glaringly profound patterns that reveal the secret to creative output. Even though everyone here is an early riser, consider someone like Hunter S. Thompson. If he was on here it would show something along the lines of waking at 3 pm to alternate between cocaine and cigarettes until a marathon of writing from midnight to 6 am. That’s a very stark contrast to what you see here yet Hunter was still a fiercely prolific and successful writer. What this infographic is really promoting is that productivity is boosted just by having a routine, whatever it may be. I’m sure though that the benefits of having structure to your day to day life isn’t really news to anyone.

Sometimes it seems like histories greatest minds were superheroes. This is a great reminder that they were in fact human just like the rest of us. They perfected their craft by devoting their time to it, which is something we are all capable of.

[Via]

daily-rituals


© Dylan Cope for Daily Infographic, 2014. |
Permalink |
No comment |

Post tags: Benjamin Franklin, charles darwin, charles dickens, creative, gustave flaubert, honoré de balzac, hunter s. thompson, immanuel kant, john milton, le corbusier, ludwig van beethoven, maya angelou, productivity, pyotr ilyich tchaikovsky, ritual, routine, sigmund freud, thomas mann, victor hugo, w.h. auden, wolfgang amadeus mozart, writing

Would You Live in a Haunted House? [Infographic]

Many holidays that we celebrate have one or two traditions that truly define them, but they also have many other smaller traditions. Halloween is no exception to the rule: while dressing in costumes and trick-or-treating are the most defining Halloween traditions, we also have things like pumpkin carving, hay rides and haunted houses that are associated with the holiday. Haunted houses can be a lot of fun to visit around Halloween, with all of the decorations and people putting on a scary show, but the question is: would you actually live in one?

Today’s infographic from the Huffington Post and Realtor.com shows us just how many Americans would choose to buy or live in a haunted home, given the choice to do so. Out of those surveyed, 62% would consider buying a “haunted” house while 35% said that they have already lived in one. When asked what would make a house haunted, most agreed that a cemetery on the property would do the trick, although the answers ranged all the way to having an old battlefield near the home.

For more info on buying haunted homes, have a look at the graphic below. [Via]


© Grayson for Daily Infographic, 2013. |
Permalink |
No comment |

Post tags: battlefield, battlefield infographic, cemetery, cemetery infographic, ghost, ghost infographic, ghosts, ghosts infographic, graveyard, graveyard infographic, haunt, haunt infographic, haunted, haunted home, haunted home infographic, haunted house, haunted house for sale, haunted house for sale infographic, haunted house infographic, haunted houses, haunted houses infographic, haunted infographic, house is haunted, house is haunted infographic, spirit, spirit infographic, spirits, spirits infographic, what makes a haunted house, what makes a haunted house infographic

Which States Love Dogs the Most? [Infographic]

Dogs are one of America’s top pets; they are man’s best friend, after all. America has a huge amount of dog owners, with one in three households being home to a furry friend, and two thirds of that number consider their dog a family member. Which states in the U.S. tend to own more dogs than others, though? On the other hand, which states have the fewest percentage of dog owners?

Today’s infographic from the Huffington Post gives us a look at some statistics for dog ownership across America. Most people getting a new dog are going to do so at a shelter, which is usually always good for the dog and shelter alike. Thankfully, very few people obtain their dog as a gift, since giving a pet as a gift can often be a bad idea.

For more info on dog ownership in America have a look at the graphic below. [Via]


© Grayson for Daily Infographic, 2013. |
Permalink |
One comment |

Post tags: Dog, dog infographic, dog ownership, dog ownership in America, dog ownership in America infographic, dog ownership infographic, dog size popularity, dog size popularity infographic, dogs, dogs in America, dogs in America infographic, dogs infographic, most popular American dog breeds, most popular American dog breeds infographic, most popular dog breeds, most popular dog breeds infographic, most popular dog names, most popular dog names infographic, most popular female dog names, most popular female dog names infographic, most popular male dog names, most popular male dog names infographic, top states for dog ownership, top states for dog ownership infographic

Don’t Drink and Tweet [Infographic]

Scenario: it’s another weekend night, so it’s time for you and your friends to go out and have some fun, nothing out of the ordinary. You’re having a good time hanging out, kicking back and occasionally checking your phone for time, texts, status updates or what have you; you’re probably not thinking about your past relationships at all. But then you knock one or six drinks back and suddenly that glorious machine in your hand holds some new-found power: you’re going to tell your ex just exactly what you think about them and you’ll be damned if the rest of the world doesn’t know too.

Most of us have probably been in a similar situation with phones/social media and alcohol, and man is that next morning ever terrible. Running clean-up on embarrassing social situations can be bad enough, but doing so with a hangover, knowing full well you may have just burned some bridges? No thank you.

Today’s graphic from Entrepreneur.com gives us a few examples of why you should probably put either the phone or the drink down if you’ve already had a few. Drunk dialing, while no less embarrassing, was so much simpler before the smartphone and social media. You have a few, make a bad call, then never speak to the person again (probably). With things like Facebook and Twitter, though, now you’ve got a magical megaphone to broadcast all of those sloppy emotions to everyone you know, and no one wants to see that.

For more, have a look at the graphic below. [Via]


© Grayson for Daily Infographic, 2013. |
Permalink |
One comment |

Post tags: alcohol, alcohol infographic, drink, drink infographic, drinking, drinking and facebooking, drinking and facebooking infographic, drinking and social media, drinking and social media infographic, drinking and texting, drinking and texting infographic, drinking and tweeting, drinking and tweeting infographic, drinking infographic, drunk facebook, drunk facebook infographic, drunk selfies, drunk selfies infographic, drunk social media, drunk social media infographic, drunk text, drunk text infographic, drunk texting, drunk texting infographic, drunk tweeting, drunk tweeting infographic

The Complete History Of Coffee [infographic]

Today’s infographic gives us a look at the history of America’s favorite pick-me-up: coffee. An estimated 1.6 billion cups of coffee are enjoyed around the world each day. This infographic shows a pleasantly structured historical timeline of the process of coffee making and some of the people involved.

Make no mistake about it, coffee is an art form to many. Some people take their coffee seriously and are constantly searching for ways to create the perfect cup. The best method I’m told is not the french press method–which I had grown quite fond of. The single-cup pour-over method is apparently the best way to go. A passionate coffee maker, barista, and local business owner recently enlightened me with this information, and also shared the secret of presoaking coffee grounds to achieve a “blooming effect.” If you pour hot water over your coffee grounds and let them soak for 30-45 seconds apparently gases are able to escape and the coffee is able to “bloom,” which results in a better tasting beverage.

I think it’s also worth noting that 54% of coffee drinkers say that coffee makes them feel more like themselves. But maybe they just like their caffeinated selves a little bit better. Either way, check out today’s infographic to learn more about your favorite cup of joe. [Via]

1infographics_coffee_final


© Micaela Lacy for Daily Infographic, 2013. |
Permalink |
No comment |

Post tags: barista, blooming, blooming effect, business of coffee, caffeine, coffee, coffee beans, coffee blooming, coffee grounds, coffee infographic, coffee shops, espresso, infographic, local coffee

Famous Personality Types [infographic]

Personality and self assessment tests are always a good exercise to run through when needing a personal boost. Though not the end all be all of you and what you are good at, only you can really know that. These tests are always helpful when one is unsure of a direction to go in or how to best pursue their goals.

Being into pop-culture is something that has always excited me. Being able to relate to current times and the people that are in it makes me feel grounded. Not unfortunately, when I took this test I was tied between two personality styles. A person with more than just one personality type (this doesn’t make you a crazy person) gives you different viewpoints that show you can exhibit more than one way of thinking.

Just for some moral support, I can look at the following infographic and see for myself some of the most iconic people. I don’t believe that I will ever be the president or sing a hit song that brings tears to people’s eyes.

What is great about this infographic is that you can study these real life successful people. You can recall a specific scene the actor was in, or a famous speech that was given in history to derive a little energy out of your results. As the saying goes, if they can do it, so can you. [via]

FamousPersonalityTypes_524daae7b512e


© J.P. Blackard for Daily Infographic, 2013. |
Permalink |
3 comments |

Post tags: assessment, exhibit, famous, personality, relate, successful, test, thinking, types, viewpoint

Brain Boosters and Brain Busters [infographic]

“Hey I’m getting Chinese, do you want anything?”

Normally I would say “Heck yeah! Get me some of that General Tso chicken!”

Eating junky food is so easy. Not to mention it tastes awesome. So often it is much easier for time’s sake to get something unhealthy than it is to get something healthy. Many believe that as long as you look fit and healthy it means that you actually are. But that is a farce. What good is looking fit if your brain isn’t getting the proper nutrients?

Eating right can be easy! All you need is to be informed. The following infograph will show you simple foods you can eat to keep your mind bright and functioning and how you can even avoid the illnesses that can often come with age.

Stay away from the salty foods! Not only are they bad for your brain, they’re bad for your heart. Stop with the fast food. If it helps, carry a backpack with healthy snacks. Plan ahead! Eating healthy doesn’t need to be expensive. Stores have deals on fish and fruits all the time. Even nuts sometimes.

The important thing is that you are aware of how the food you consume will affect you in the long run. If looking fit turns people on, shouldn’t a brain with a healthy dose of all the essentials be sexy too? [via]

brain-boosters-and-brain-busters_523ac6280e90f


© J.P. Blackard for Daily Infographic, 2013. |
Permalink |
2 comments |

Post tags: Brain, Diet, food, functioning, Healthy, illness, nutrients, plan, sexy, unhealthy

1 2 3