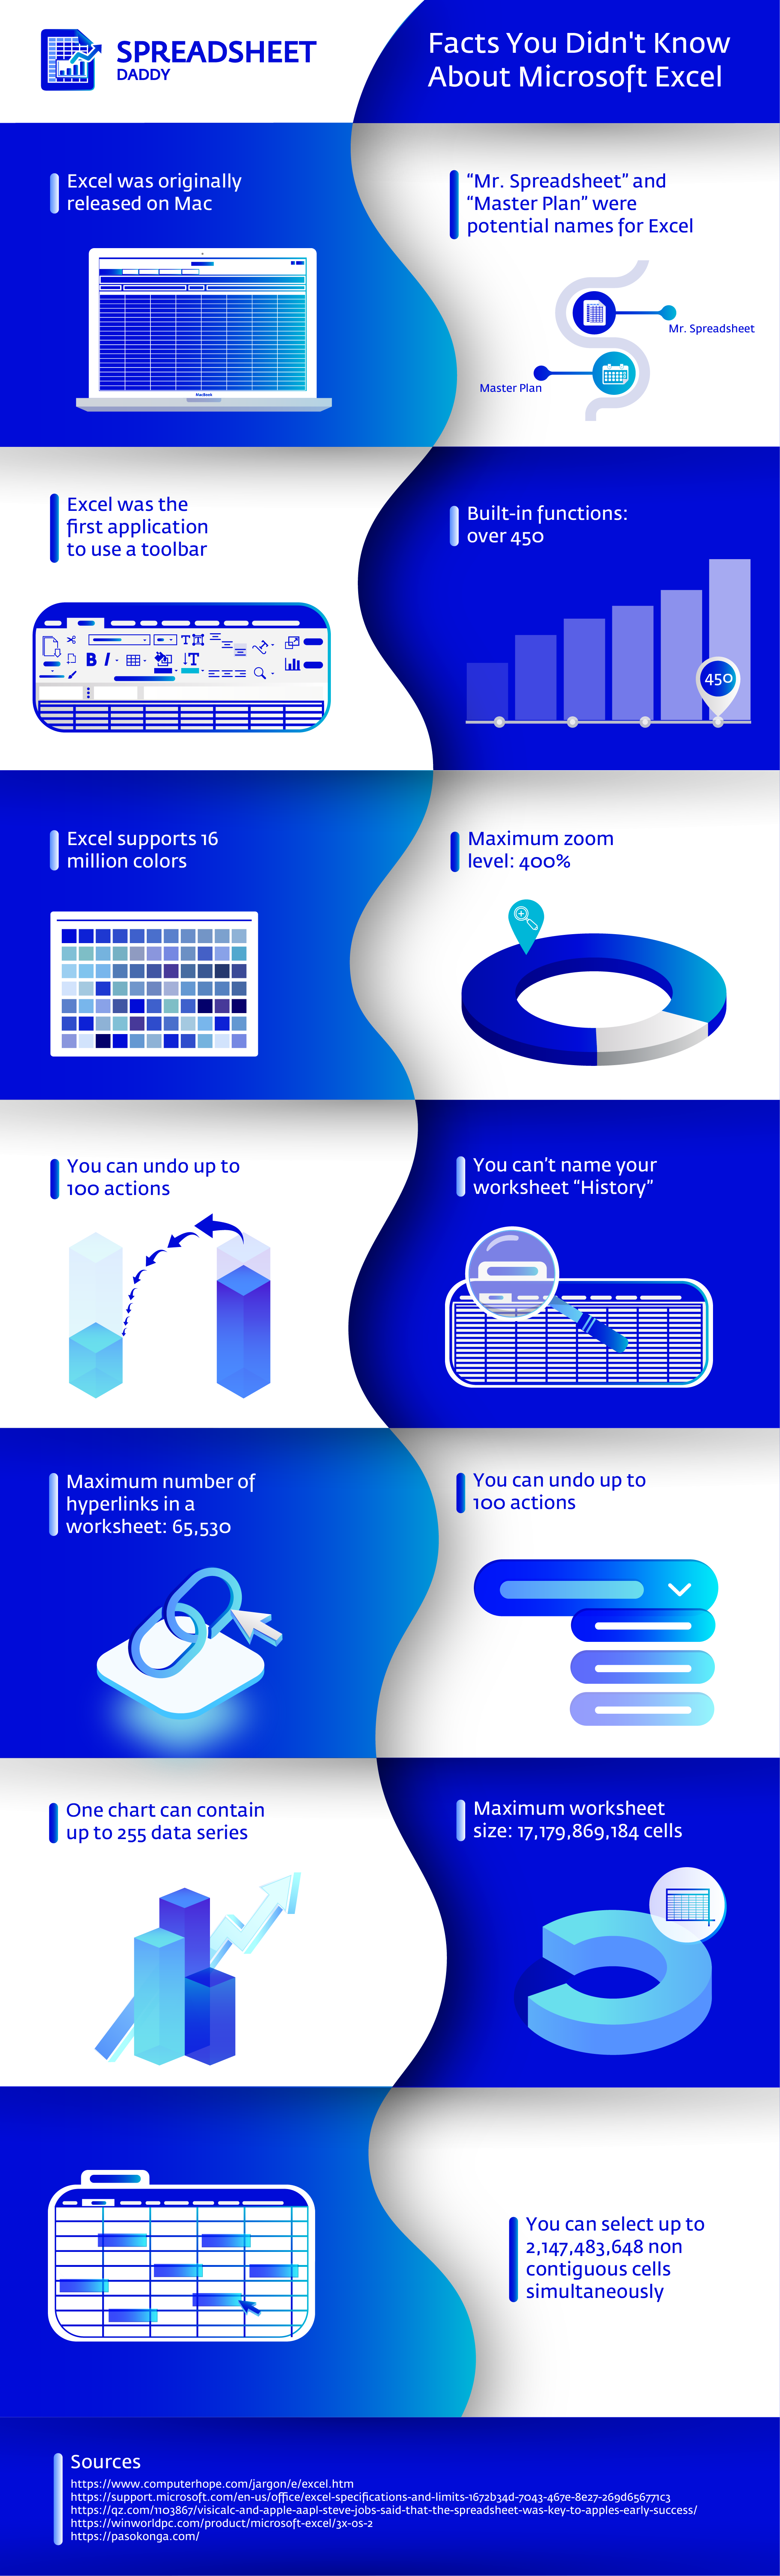
Top 13 Excel Facts & Statistics For You

Excel. It’s a program that has been around for decades, and it has experienced explosive growth in popularity over the last few years.  But what is it?

Excel is a software program that allows you to store and manipulate data. You can use Excel to create charts, graphs, and tables, as well as to perform calculations. It’s a great tool for business owners, students, and anyone who needs to track data.

Excel is available for both Windows and Mac users. There are two different versions: Excel 2016 and Excel for Office 365.

The 2016 version is the most recent release, while the Office 365 version is subscription-based. Both versions have the same features, but the Office 365 version offers additional tools, including the ability to collaborate with others in real time.

This infographic will illustrate the most popular facts about Excel brought to you by Spreadsheet Daddy: https://spreadsheetdaddy.com

9 STEPS TO CREATE AMAZING EBOOKS IN 5 MIN – INFOGRAPHIC

This infographic shows you the
9 step blueprint how to create winning eBooks that SELL.

Just click, design and publish your own ebooks, reports and whitepapers in minutes!

Publish Directly From Your Sqribble Dashboard.

Just tab the “generate” button at the top of your dashboard to instantly create ebooks online!

You can open it online, share it with anyone, or download it to your computer.

This simple plan when executed properly can help you generate a 10K/MONTH business with the right eBook creator like Sqribble.

The KEY is action & consistency, even if small steps done frequently.

Infographic presented by www.sqribble.com

How Technology Impacted Music: 50 Years of Change

Over the past two years, leading mobile phone and gadget insurer, loveit coverit, have been exploring and assessing the impact that smartphones have had on our modern life; from the effect on childhoods, to relationships and shopping. In this new research piece, they’re looking at how smartphones have changed the way we listen to, enjoy, and consume music. Supported by testimony from industry professionals and independent research, this is a holistic examination of the positives and negatives that technology has brought to the music scene.
 
As a visual representation, this infographic explores the past 50 years of music technology, highlighting the key points where the medium as been impacted forever. This includes when vinyl and tapes were first introduced, to the rise and fall of the CD format, and when streaming services first made their mark on the industry. If you’re looking for some interesting facts about music history, and want to see how far we’ve come, this is perfect for you!
 
when streaming services first made their mark on the music industry

The Rising Cost of Repairing Your iPhone

With a starting price of £999, the iPhone X is arguably the most expensive phone currently on the market and it seems as though other smartphone providers are following suit.

Unfortunately, higher price tags on the latest handsets also means that repair costs are increasing, especially when it comes to replacement screens. Our infographic shows how the cost of repairing your device is rising and why it really does pay to get insurance for your iPhone.

Repairing Your iPhoneInfographic presented by: www.loveitcoverit.com

Factors Affecting Your Internet Speed

There’s nothing more frustrating than having slow Internet connection. But what is slowing your Internet down? This Infographic from BlueGadgetTooth will show you 10 factors that can be slowing down your Internet. From placing your wireless router to a perfect spot, using the fastest browser to having the latest hardware, we’ve got you covered. Check out the Infographic and boost your Internet speed with a few simple tips.

Infographic presented by: bluegadgettooth.com

1 2 3