Information Made Beautiful: Infographic Design
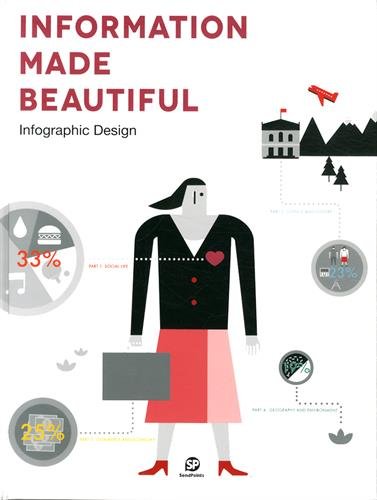
Overwhelming amounts of information are available for readers and consumers in modern times, but how can it be made understandable, and given context and importance? The designers and creatives whose works are featured in Information Made Beautiful address these issues with projects that don t just make data easy to understand, but make it understanding it an appealing experience. Work from over 100 designers and studios includes projects for clients such as Wired Italy, the Royal Mail, Money Today, Lionsgate Entertainment, Ronald McDonald House, and the UN, as well as universities, research facilities, and private clients. These pieces range from abstract to hands-on, and break down information ranging from the status of female children in India and global water usage to coffee bean maps covering the amount of caffeine consumed in the US and crocheted diagrams of time spent crafting on German public transportation. The bright colors, eye-catching graphics, and specialty typographies of Information Made Beautiful make it easy to understand how designers are translating this new form of visual language to create information that is also inspiration.

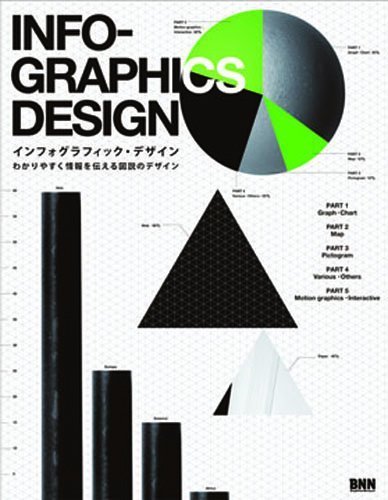
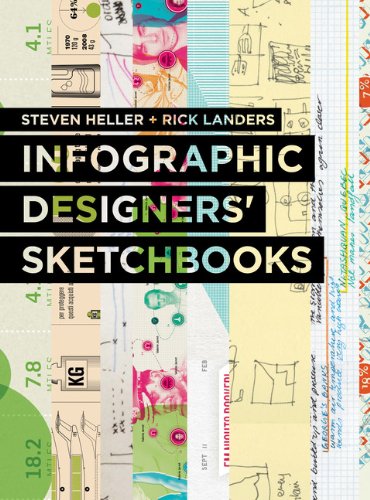
Infographics Designers’ Sketchbooks

We are living in a golden age of data visualization, in which designers are responding to the information overload of our digital era with astonishing feats of visual thinking. Using a wide variety of techniques, they transform complex ideas into clear, engaging, and memorable infographics. In recent years, books and websites have been collecting the field’s best. While stimulating, these finished projects offer little insight into how visual solutions were reached, making them of limited use to designers wanting to produce work of their own. In Infographic Designers’ Sketchbooks, more than fifty of the world’s leading graphic designers and illustrators open up their private sketchbooks to offer a rare glimpse of their creative processes. Emphasizing idea-generating methods—from doodles and drawings to three-dimensional and digital mock-ups—this revelatory collection is the first to go inside designers’ studios to reveal the art and craft behind infographic design.

MailChimp vs. Constant Contact

How does email automation differ from simply sending mails? Well, in a way that these automated emails are strongly relevant to the reader, personalized, sent at the right time and thus have a much bigger chances of being opened and clicked. This of course drives more visits as well as revenues for your business. The content of your emails depends on your contact’s and social data, interests, interactions and finally, your creativity. And all of this wouldn’t be possible without the right tools. There are plenty of email automation solutions on today’s market, but we can certainly say the two most used are definitely MailChimp and Constant Contact.  With more than a decade of being around they’ve got enoug
h time to analyze, mature and refine. Let’s see which one comes out as a favorite in InsiderHub’s brand-new infographic.

Via InsiderHub

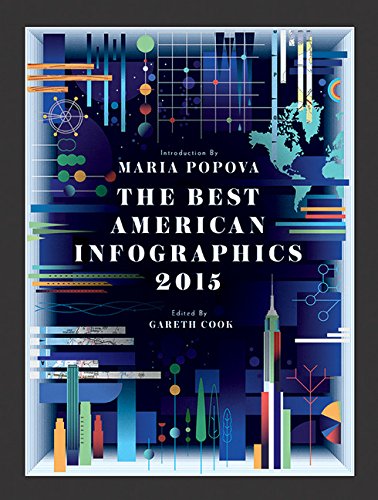
The Best American Infographics 2015

Praise for The Best American Infographics 
 
 “Represent[s] the full spectrum of the genre—from authoritative to playful.”—Scientific American
 
“Not only is it a thing of beauty, it’s also a good read, with thoughtful explanations of each winning graphic.”—Nature
 
 “Information, in its raw form, can overwhelm us. Finding the visual form of data can simplify this deluge into pearls of understanding.” —Kim Rees, Periscopic
 
 The most creative and effective data visualizations from the past year, edited by Brain Pickings creator Maria Popova
 
The rise of infographics across nearly all print and electronic media—from a graphic illuminating the tweets of the women of Isis to a memorable depiction of the national geography of beer—reveals patterns in our lives and the world in often startling ways. The Best American Infographics 2015 showcases visualizations from the worlds of politics, social issues, health, sports, arts and culture, and more. From an elegant graphic comparison of first sentences in classic novels to a startling illustration of the world’s deadliest animals, “You’ll come away with more than your share of . . . mind-bending moments—and a wide-ranging view of what infographics can do” (Harvard Business Review).
“This is what information design does at its best – it gives pause, makes visible the unsuspected yet significant invisibilia of life, and by astonishing us into mobilization, it catapults us toward one of the greatest feats of human courage: the act of changing one’s mind.”—from the Introduction by Maria Popova

Guest introducer MARIA POPOVA is the one-woman curation machine behind Brain Pickings, a cross-disciplinary blog showcasing content that makes people smarter. She has more than half a million monthly readers and over 480,000 Twitter followers. Popova is an MIT Futures of Entertainment Fellow and has written for the New York TimesAtlanticWired UKGOOD Magazine, The Huffington Post, and the Nieman Journalism Lab.
 
Series editor GARETH COOK is a Pulitzer Prize–winning journalist, a contributor to the New York Times Magazine, and the editor of Mind Matters, Scientific American’s neuroscience blog.  He helped invent the Boston Globe’s Sunday Ideas section and served as its editor from 2007 to 2011. His work has also appeared in NewYorker.com, WIRED, Scientific American, and The Best American Science and Nature Writing. 


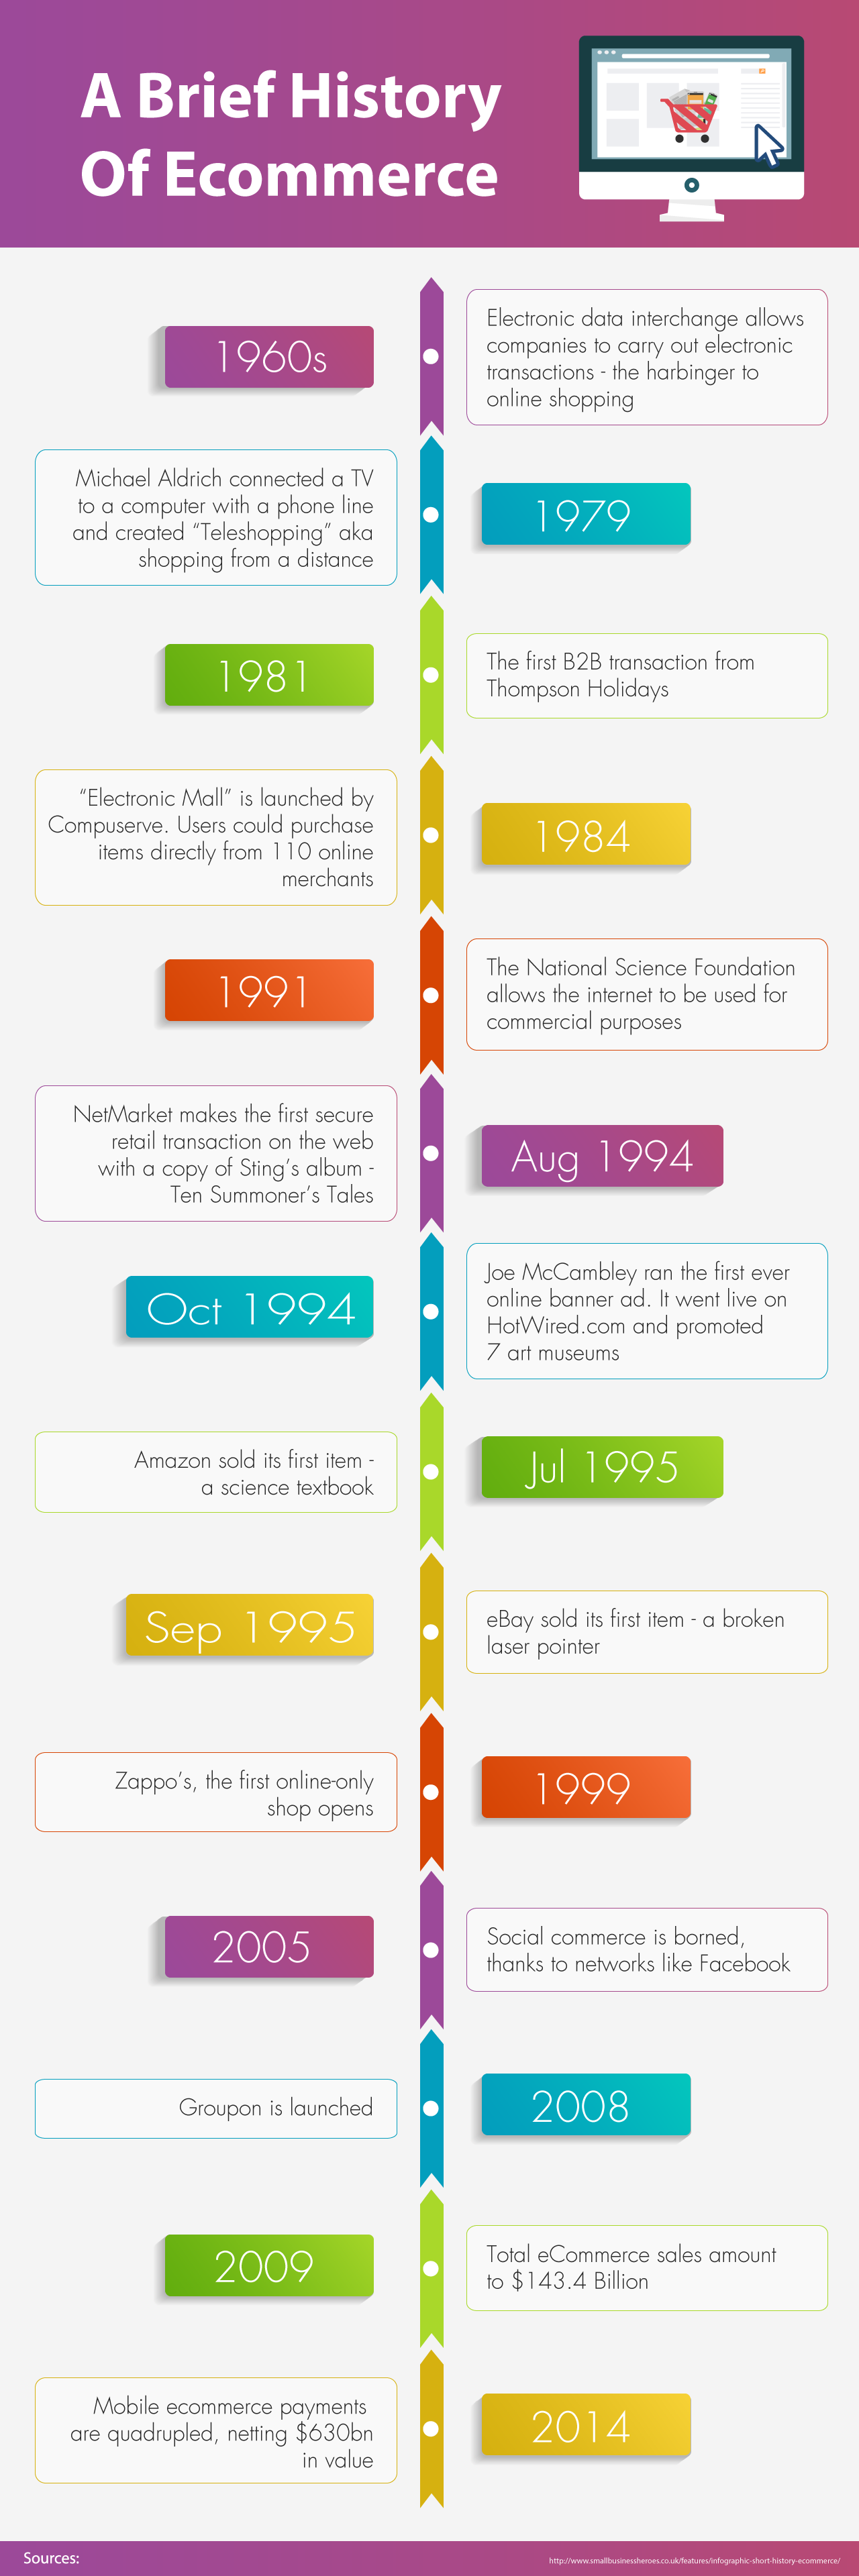
A Brief History Of Ecommerce

[simpleazon-image align=”none” asin=”0956526209″ locale=”us” height=”160″ src=”http://ecx.images-amazon.com/images/I/516fhvwrZQL._SL160_.jpg” width=”123″][simpleazon-image align=”none” asin=”151534567X” locale=”us” height=”160″ src=”http://ecx.images-amazon.com/images/I/51iNXUjivML._SL160_.jpg” width=”107″]
A-Brief-History-Of-Ecommerce

1 26 27 28 29 30 40